Since I’ve spent time with Palladio before, I returned there to begin working with the American Ballet Caravan data. It remains a very clean interface through which to visualize simple point and point-to-point poster-style maps, and to filter those based on simple parameters.
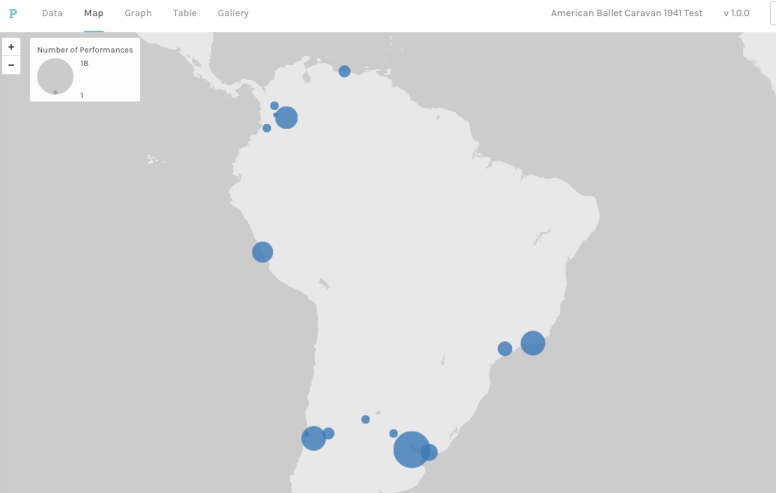
For example, here is a map of South America, with points sized for the number of performances in each of the respective cities, up to a maximum of 18 down to a minimum of 1.
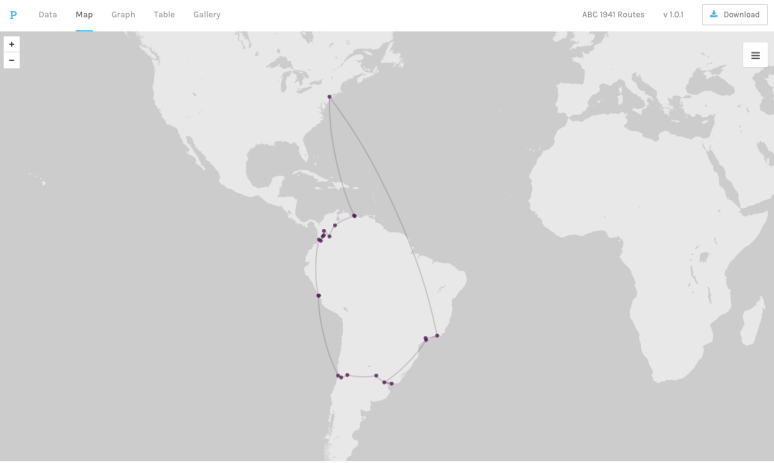
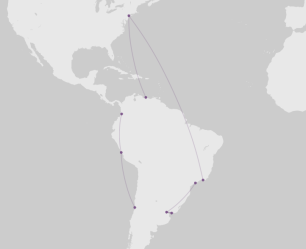
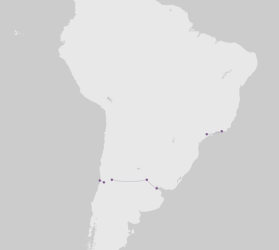
And here is another map with the full route plotted, followed by versions filtered for two different types of travel.
Filtering the point-to-point map by the facet of transportation is fascinating. It not only helps to trace a route and establish distances between places, but also serves as a reminder of the functions of different forms of transportation. For example, in the train image, the gap between the third- and fourth-from-left dots represents a trip that was scheduled to occur by train, but was delayed by snow and ultimately occurred via airplane. At the same time, what looks like a small gap represents what was in fact a huge financial and logistical hurdle. It would be great to be able to apply colors to these different types of transportation and view them together.
Putting these two Palladio functions together could reveal which locations were critical, versus which merely “on the way.” For example, why travel a far distance via multiple forms of transportation for only a few shows? Unfortunately, each parameter can only have one extension, and only one primary table is allowed. Starting with the data from the point-to-point map for the primary table, requires that “source” and “destination” cities be specified, each of which can only have one extension (coordinates), not also number of performances. On the other hand, starting with the data from the map that sizes points based on number of performances for the primary table means that they cannot also be extended as source/destination cities. A further issue is that the exact travel dates are not as clearly documented as the performance dates. I attempted to build a Franken-file as the primary table, with lots of redundancies (ie: city, source, and destination all pull from the same coordinates extension), but am still searching for the correct database format.
Another feature of Palladio that I worked with previously was the timeline.
Palladio has come a long way, for example with the error downloads, although there are definitely still some bugs, such as raw code popping up in places where the user should be choosing parameters for a map. I have not yet tried installing locally, but that should be the next step, because one of my frustrations with the browser-based version of Palladio has to do with its user interface. I understand all of the reasons they don’t store data (I wouldn’t want to be blamed for losing a humanities academic’s data, either, especially when there is a darn good chance it’s a pebkac-kind of issue), but the flip side is that it is extremely unstable. There are quite a number of ways to hit a button that refreshes or the equivalent to knock you back to the original upload page, in order to add all of your data and begin again.


